How it works

Better Reporting in 4 Simple Steps

Turn scattered platform data into clear, connected insights.
Reporting updates itself so you can focus on decisions, not dashboards.

1. Connect Your Channels

Add Google Ads, Meta Ads, Search Console, and GA4 depending on your plan. Your reporting foundation is ready in minutes.

2. Let the Data Flow

Performance updates automatically every day and every month. No exporting, no copy-paste, no broken dashboard templates.

3. Explore Ready-Made Dashboards

See KPIs, trends, and performance by channel, campaign, and metric. Built for clarity, no setup or design work needed.

4. Share Insights Instantly

Share live dashboards or export the underlying data to Excel. Give access to any stakeholder for clear, consistent reporting.
Reports Ready Exactly When You Are.
No manual exports, no broken Looker dashboards, no missing metrics. Just clean, reliable insights updated automatically every day.
Book a Demo
Integrations

How Reporting Syncs Your Data

Reporting pulls fresh performance data directly from your connected channels.

Daily dashboards show yesterday’s results; monthly dashboards reveal long-term trends without any setup or maintenance.

Supported channels: Google Ads, Meta Ads, Search Console, Google Analytics.

Everything updates automatically — no Looker, no Excel, no manual refreshes.
media plan summary in Climbinsearch

Start using reporting that stays ahead of you.

One place for all your performance data. Always fresh, always consistent, always ready to present. No setup, no maintenance, no spreadsheets.
Book a Demo

Frequently Asked Questions

Reporting is built to turn campaign performance into a consistent reporting system your team can reuse every month.

Below are answers to the questions teams ask when they want faster reporting, clearer structure, and fewer manual updates.

Still have questions?

If you want to review your reporting structure, KPIs, or what an automated monthly reporting flow would look like, book a short call and we’ll guide you through the best setup.
Contact Us
We already have dashboards. What problem does Reporting solve?

Most teams can access performance data.
The problem is turning it into a consistent reporting process.

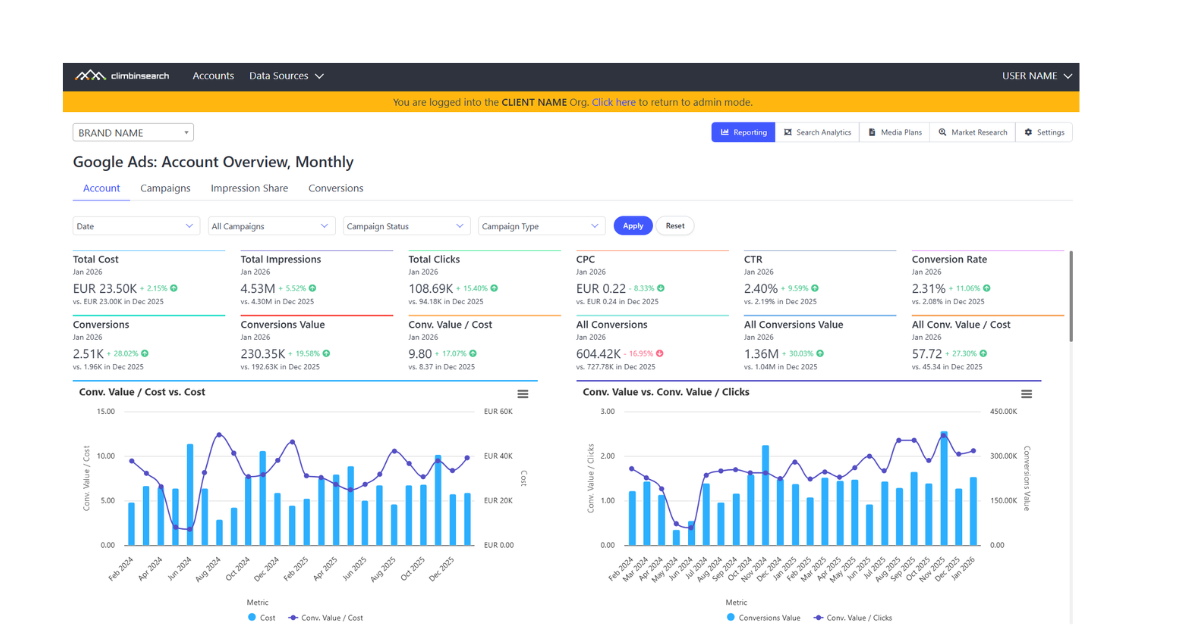
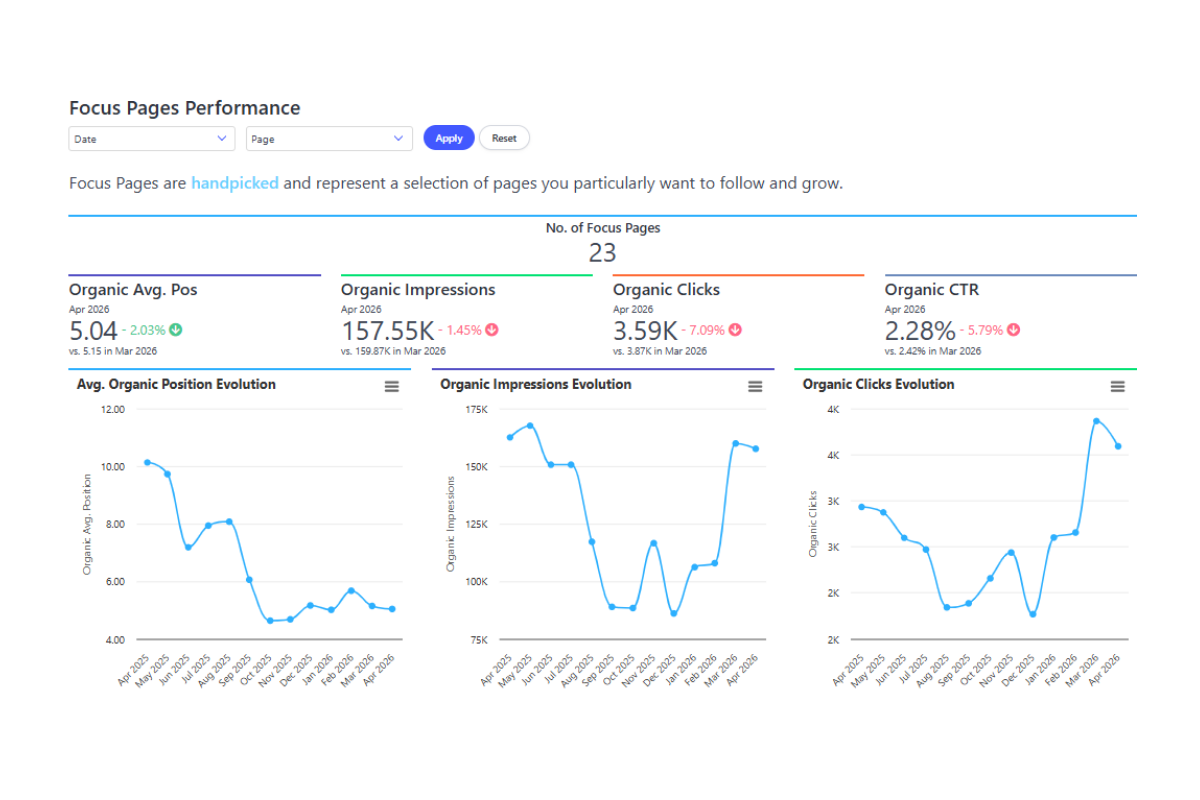
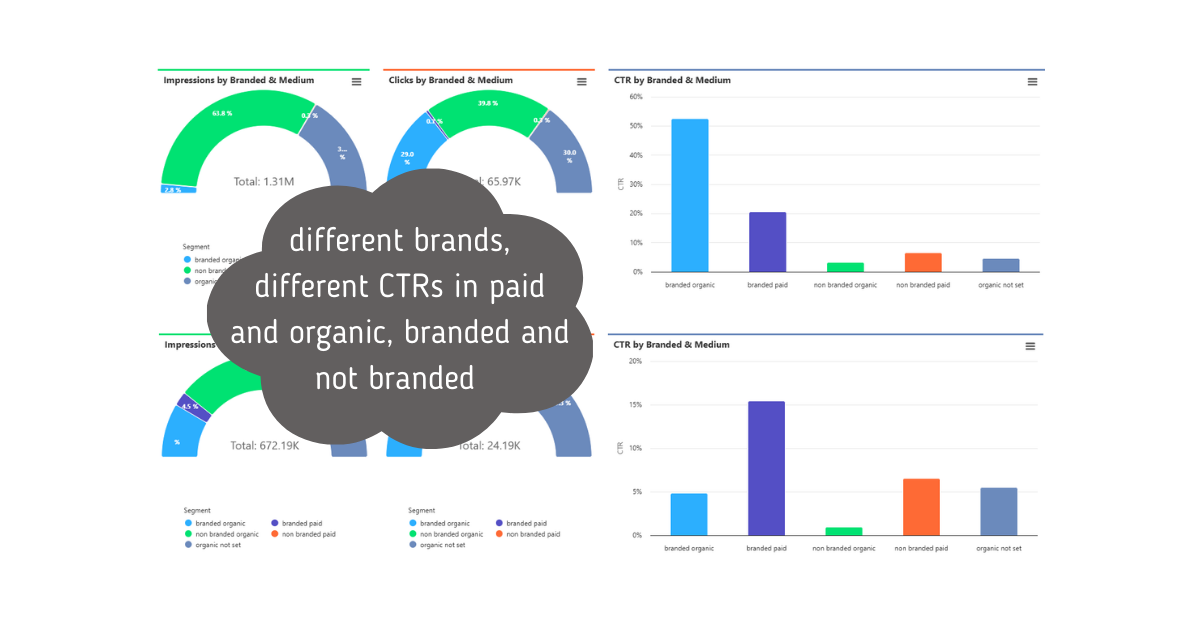
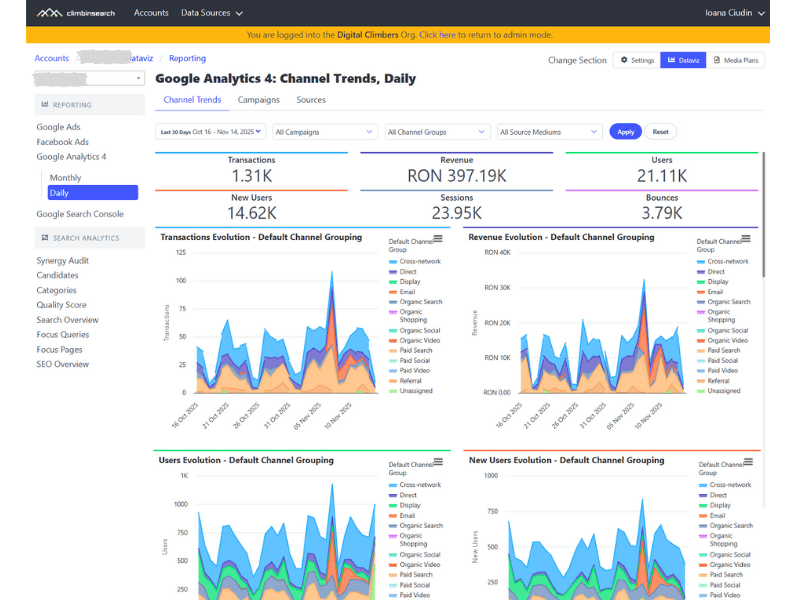
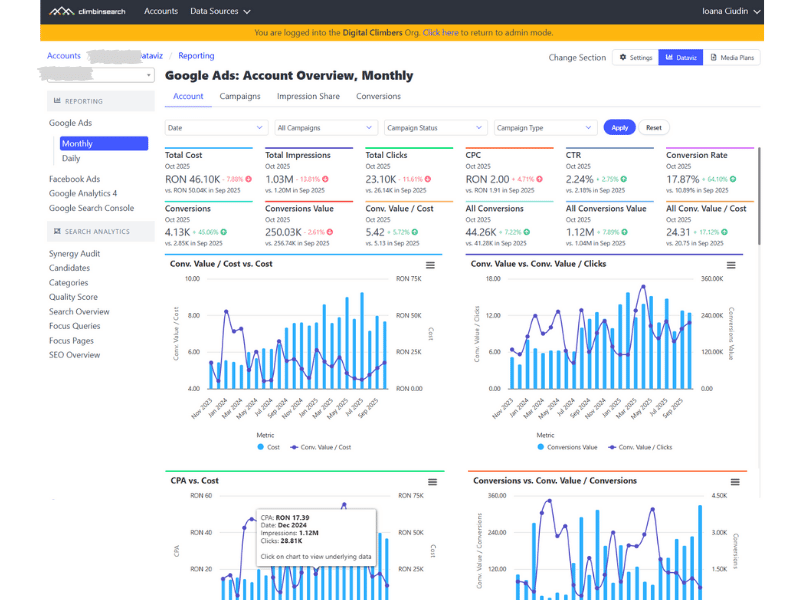
Reporting removes exports, slide rebuilds, and inconsistent KPI definitions. It gives you one shared structure for performance reviews, so reporting becomes repeatable and easy to understand.

How is this different from dashboards?

Dashboards show data.
Reporting creates clarity.

It is built for recurring reviews: the same KPIs, the same logic, and the same structure month after month, so stakeholders focus on decisions, not on interpretation.

Who uses Reporting day to day?

Specialists use it to validate results and reduce manual reporting work.
Client Leads use it to keep accounts consistent and easy to review.
Clients use it to see performance in a clear structure, not a collection of links and screenshots.

When does Reporting make the biggest difference?

When you manage multiple campaigns, channels, or stakeholders and reporting takes too long.

If every month feels like rebuilding the same deck, this module creates the standard that keeps performance communication clean and scalable.

What does automation mean in Reporting?

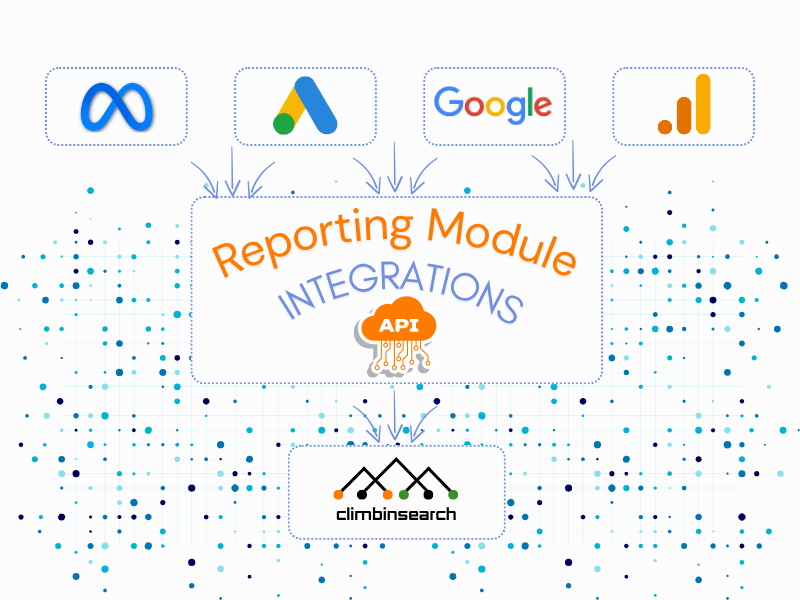
Automation means your reporting structure stays intact while the data updates.

Instead of rebuilding the same reporting pack every month, you work from a stable framework that refreshes with the latest results, so time goes into analysis and decisions.